Improvements of a Maintenance Task Management App

UX Research
Product design

Project Overview

The task manager app was designed for maintenance supervisors to track calls received when operators faced issues with their trucks. Our goal was to identify key pain points to increase user satisfaction, and the maintenance data collected.

Role & duration

Sole UX Designer. Collaborated with the PO, one Subject Matter Expert (SME), and four developers.
6 months.

Problems

The initial MVP faced ongoing criticism for being less user-friendly than Excel, the previous solution. Additionally, it did not collect significantly more data than its predecessor.

Hypothesis

  • Users preferred Excel because they were familiar with it. We believed that with time, they would come to appreciate the app's advantages over Excel.
  • If we made the process of adding and updating calls faster, users will be more likely to enter more data about repairs right at the time of events.

Results

  • 1st hypothesis to be false. Although we conducted usability testing before release, tasks took longer to complete in the app compared to excel.
  • 2nd hypothesis to be partially true. Interaction and logic improvements resulted in more data collected, although not at the time of events.
  • User Satisfaction: Initially, user satisfaction was low, scoring 3.0 out of 5. After six months, it increased by 20%, rising to 3.6 - 3.0 among primary users and 4.5 among secondary users.
  • Business Goals: Users recorded 20% fewer calls in the app compared to Excel, but the number of comments increased by 34%. Each call and comment contained twice as much metadata compared to Excel.
πŸ‘
3.6/5
Satisfaction score
20% increase
πŸ‘Ž
20%
Decrease in the average number
of calls recorded
πŸ‘
34%
Increase in the number
of comments entered
The process
Discovery and Define
  • Collect user feedback: We set up a feedback channel for maintenance supervisors and booked sessions to gather their initial feedback.
  • Backlog prioritization: Reviewed and prioritized feedback with stakeholders.
  • Remote interviews: Conducted interviews to understand the root causes of issues.
Ideate, test, implement
  • Sketches & wireframes: Created preliminary designs.
  • Usability testing: Tested designs remotely with users to identify the best solutions.
  • Mockups & user flows: Created detailed designs and prototypes for development to build
Validate
  • Iterative feedback loop: Measure user satisfaction as well as usage behaviours
  • Backlog prioritization: Reviewed and prioritized feedback with stakeholders.
Understand

User flows

Based on the feedback we collected, we mapped out business processes to identify decision points across the operation and created detailed flows for user and system interactions.
Problem solving

Problem 1: Difficulty Reading Data

Supervisors needed to compare multiple calls to troubleshoot or identify updates, but the app showed limited call data.
Solution
  • Enhanced column and row formatting to display more details upfront.
  • Added color codes to repair statuses for easier identification of pending calls.
Results
  • πŸ‘ User Feedback: Supervisors expressed appreciation for the improved format and found it significantly more helpful.
β€œThank you for listening, that format change makes all the difference. Big help for me” Maintenance Supervisor

Problem 2: Time Spent Editing Calls

Users needed to open the call side panel form to make updates, which was easier in Excel.
Solution
Improved inline editing and enabled keyboard navigation for faster updates and new comments.
Results
πŸ‘ Adoption Rate : 54% increase in inline edits within two months of the release.
πŸ‘ Business Goal : 34% increase in the number of comments entered

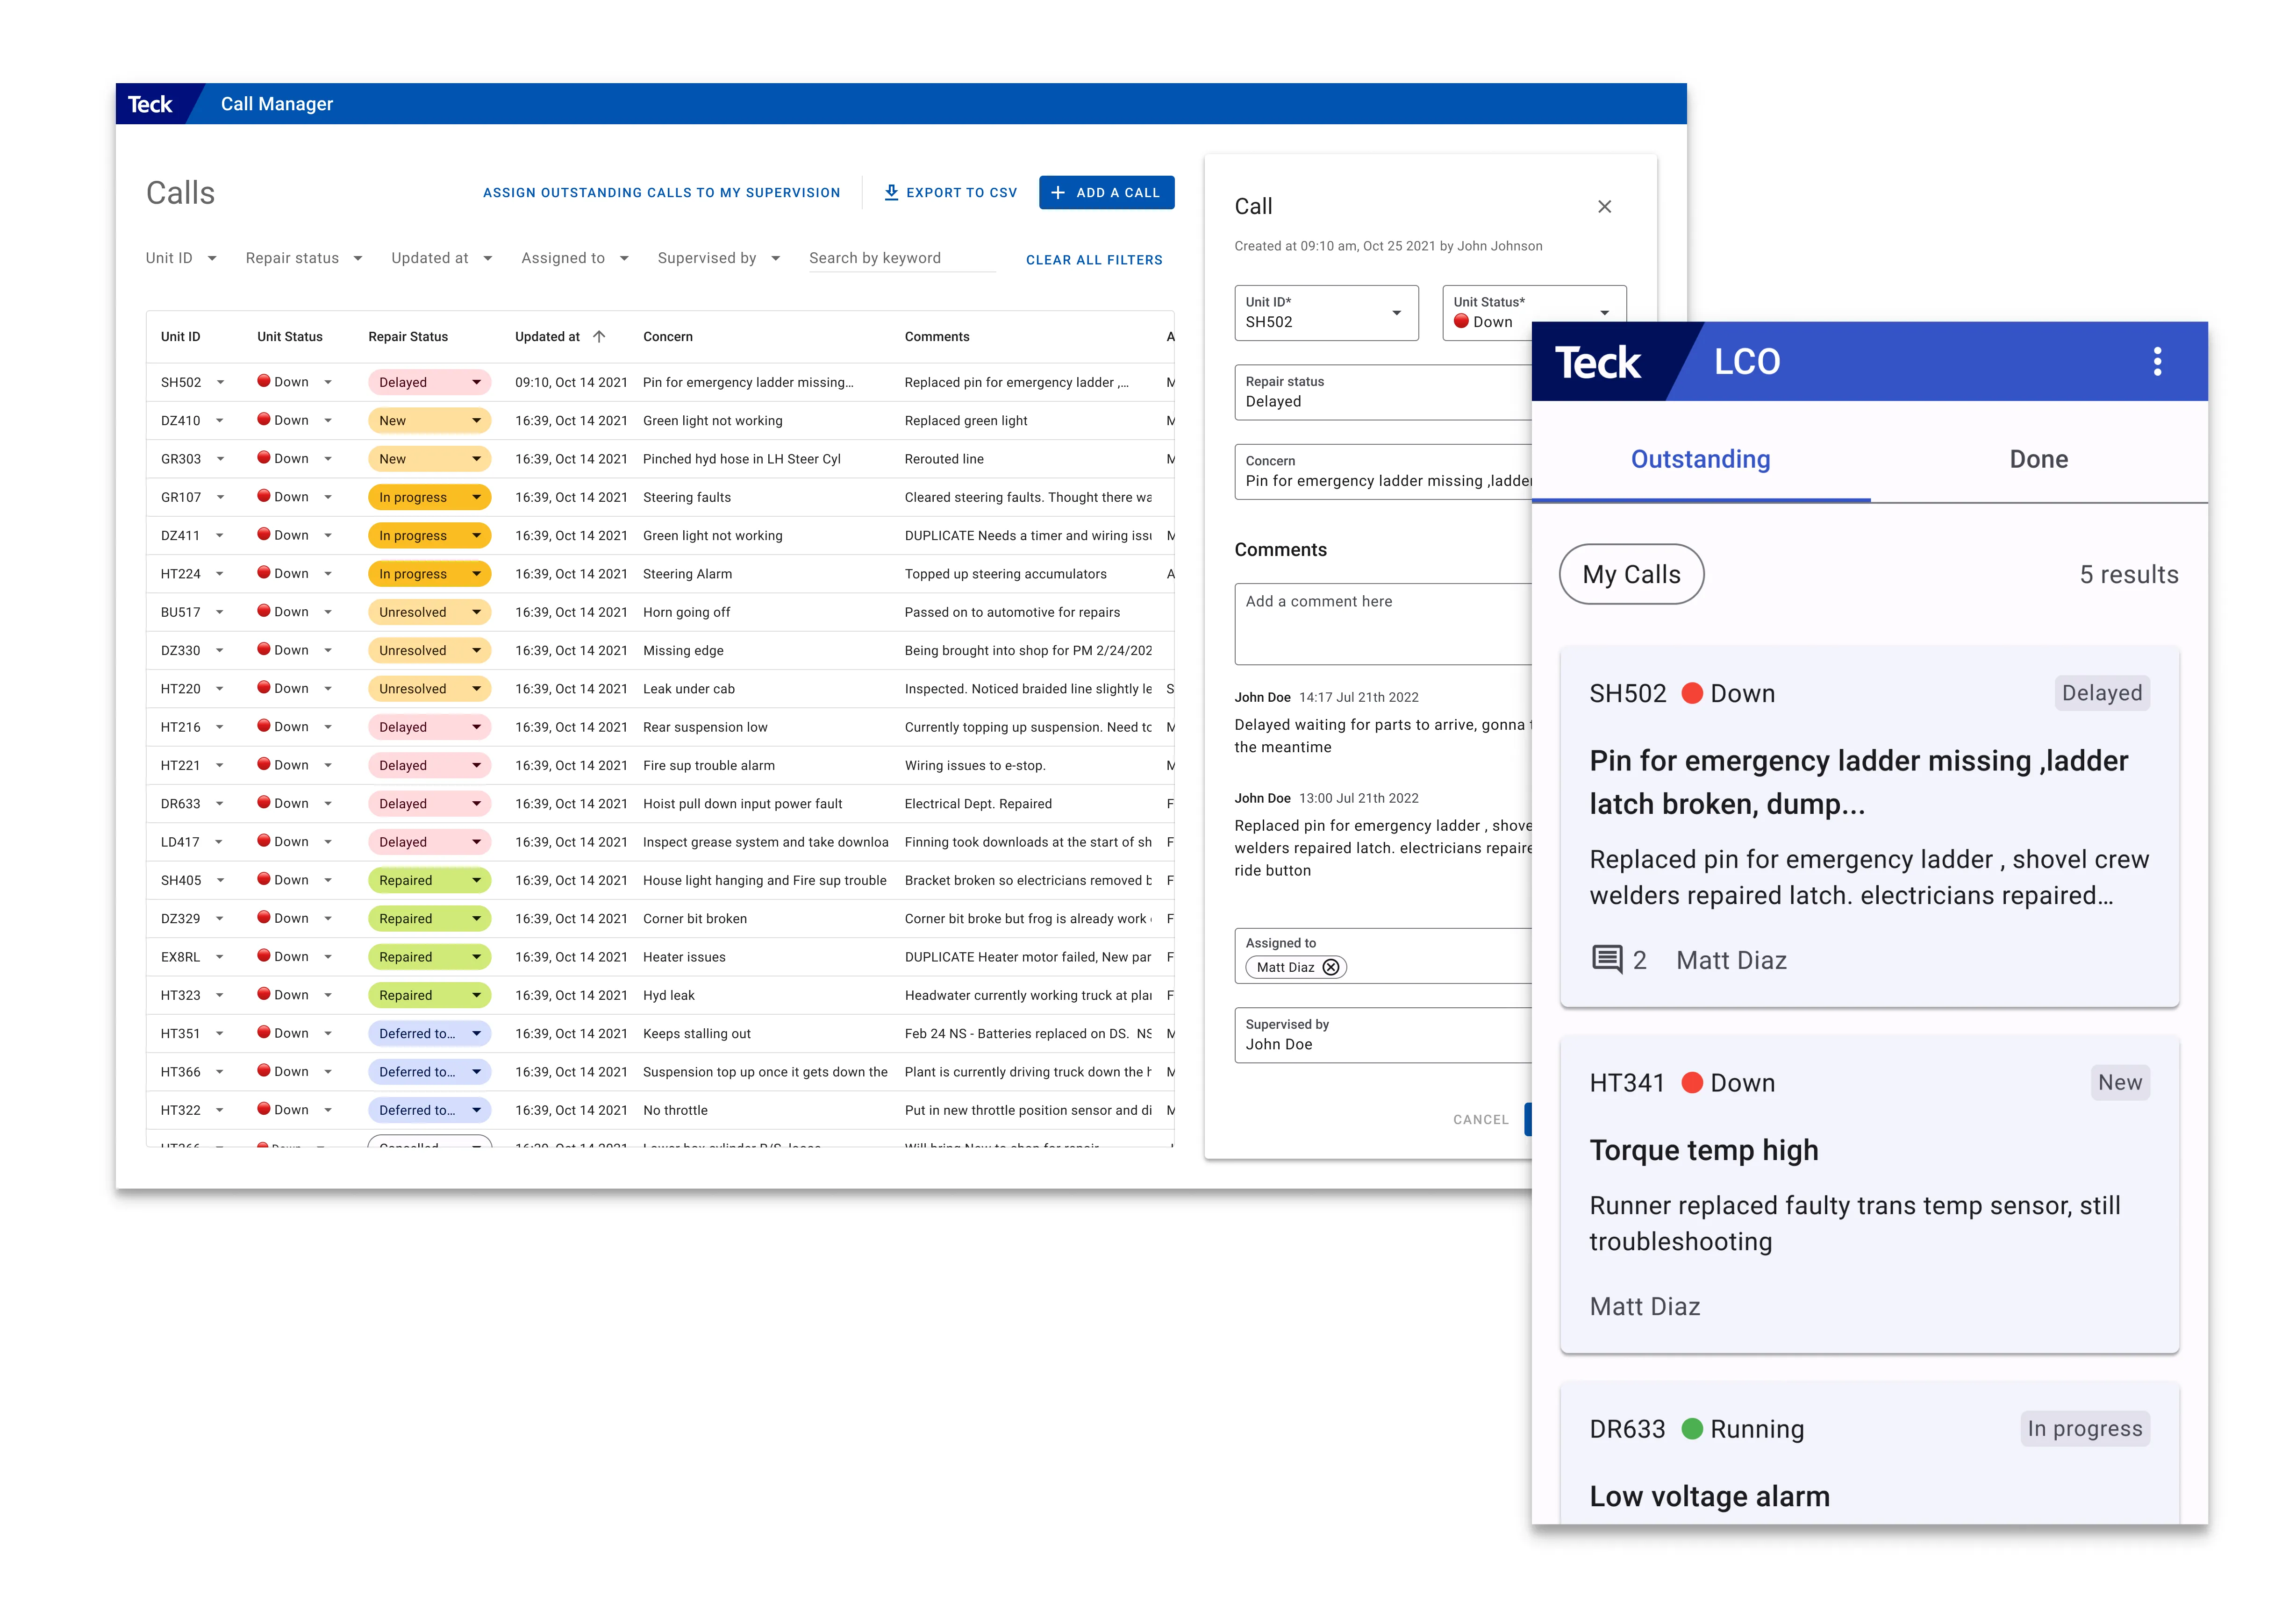
Problem 3: Time Spent Updating Calls

  • Supervisors needed to track both outstanding from previous shifts and new issues.
  • The app lacked a simple way to group calls needing attention.
  • Supervisors had to manually filter and assign calls to themselves (30 calls approx.), which was time-consuming.
Solution
Implemented a button to assign all outstanding calls to a supervisor with one click, saving around 20 minutes per shift.
Results
  • πŸ‘ Log Analysis: Updates per call reduced by 70% in the month following the release.
  • πŸ‘ Usability testing: The total time saved updating 30 calls every shift was ~10 minutes.
  • πŸ‘ User Feedback: Supervisors reported increased efficiency and satisfaction with the new functionality.

Conclusion

This project was a significant learning experience in understanding user behaviours and addressing resistance to new tools. By thoroughly researching user needs, collaborating closely with stakeholders, and iterating based on feedback, we were able to enhance the task manager app significantly.
‍

Impact

  • Improved user satisfaction and productivity.
  • Reduced time spent on key tasks by up to 70%.
  • Increased metadata richness, aiding in better issue tracking and management.

Lessons learned

  • Usable doesn't mean useful: Usability testing in complex domains can be challenging when access to users is limited, making it hard to identify use cases and replicate scenarios. A more accurate assessment emerges when users interact with the solution in a real-world setting.
  • Don't stop the research: Avoid the mistake of postponing user feedback collection until you have defined specific questions or metrics. Continuous collection of feedback is essential; otherwise, you'll lack the necessary data for analyzing performance over time.
  • Collaboration and transparency: Close collaboration with stakeholders ensures alignment on priorities and solutions. Being transparent about our decisions and limitations would also facilitate smoother conversations and alleviate future pressure.
HomeMy work